sim_data <- data %>%
rep_sample_n(size = 50, reps = 10000)Repeated Sampling
Section 9.2 - 9.4
Overview
The theory of repeated samples makes it possible for statisticians to take a random sample from a population and use it to make inference about that population’s parameters.
Definitions:
- Repeated Sampling: repeating the exact same random sampling procedure many times.
- Sampling variability: some sample estimates are bigger and some smaller than the true population statistic
- Standard error: the standard deviation of a sampling distribution
- Sampling Distribution: a probability distribution of a statistic (mean, proportion, or variation) obtained from repeated sampling. This distribution is visualized with a histogram.
Simulations in R
The theory of repeated samples is quite straight forward:
- Imagine repeating the exact same random sampling procedure where you sampled 50 people from the population, say 10,000 times.
- For each of the 10,000 samples, each with 50 people in them, calculate a sample statistic, say the sample mean. That is, you now have 10,000 sample means.
- Now examine the distribution of the 10,000 sample means. This distribution of sample means is know as a sampling distribution. A distribution that is the result of repeated sampling.
Code in R:
Simple example
Let’s say we want to estimate the average height of a college student. You take a random sample of size 2. And repeat this procedure 4 times.
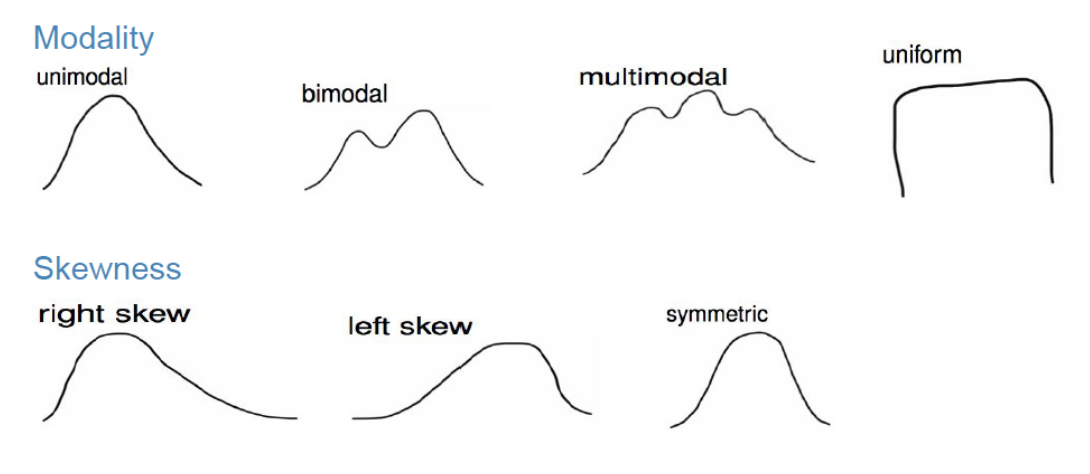
Describing a Sampling Distribution
![]()