Final Project
The final project is to be completed in groups of 3-6. Why? 1) Group work and collaboration is a good life skill. 2) There is no possible way we can grade 150 projects by the time grades are due.
The final project is due on Monday Dec 9th 11:59pm. Groups are expected to submit their project electronically to Canvas, similar to how you submit your work for daily activities. You will type your project directly into a qmd file and render an html document. You should submit your .html file (and dataset if you chose one other than the one I provided). Only ONE person from the group needs to submit the project. Make sure everyone’s name is on the project. Look at your rendered document before submitting - your project will be graded as it appears in the submission.
This should read as a report! The project should be in paragraphs and complete sentences within the context of your dataset when appropriate. Do not bold or italicize your entire paper. Do not begin a section with code, you should introduce context before showing graphics/code. Students are expected to also show their work (i.e., include your R code). Your target audience is the grader and myself, we want to see your code and the output of your code.
Choose a Group
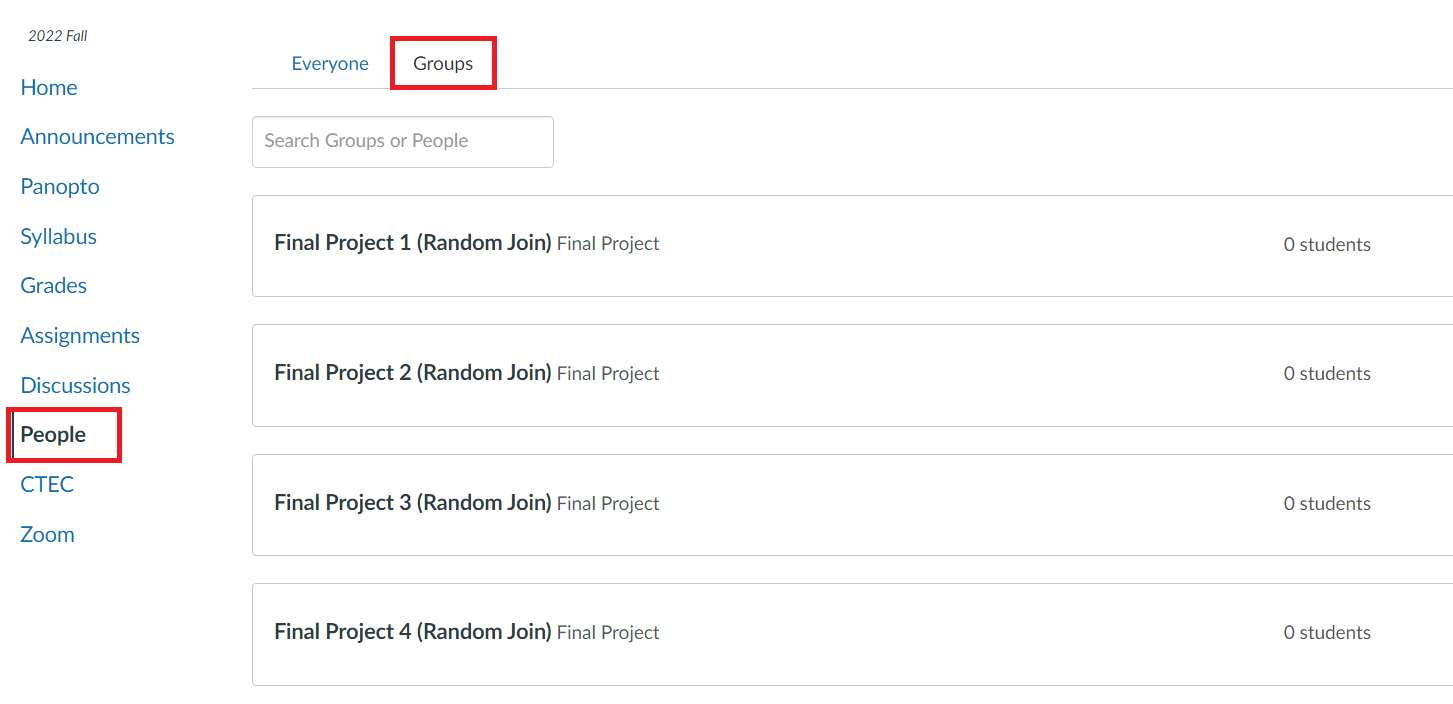
You must join your group on Canvas! Grades are linked to these groups - I will not hunt you down. To get a grade you must be in a group. This is 10% of your grade, you do not want a 0 for the project. On Canvas go to the People tab, and select Final Project Group to add yourself to a group.
Everyone in your group must agree to be in your group. I should not be getting emails stating “Jane Doe is in my group and we don’t know who that is”. If you do not know anyone in the class, Groups 1 - 8 are titled “Random Join”. Anyone can join them. You can communicate with your group through the Canvas group, make a group on Campuswire, or exchange email.
The most effective ways groups have found to work together is by creating a Google drive document that members can copy/paste code into to share and jointly edit the report. It is very obvious when groups have a single student take a section of the project rather than working collaboratively, those groups tend to do poorly on the project.
Choose a Dataset
This is your chance to work with a “real-life” dataset!
Option 1:
You may use a dataset that I provide. This dataset will be pre-loaded and located in the Posit Cloud Project.
- Class Survey Data: You cannot use any analysis that is an existing question on your exam. You may think of a similar question but it should not be identical. You must use the full dataset, the midterm and final remove certain columns and observations to reduce time computations. See the codebook for an explanation of the variables.
Option 2:
As a group you can pick a dataset of interest to explore! This can be any dataset of your choice that meets the following criteria:
At least 100 observations
At least 10 variables
The variables should be a mix of both categorical and numeric
At least one variable that can be used as a reasonable response variable for regression
You may not use data that has previously been used in any Activity
You may not use any data that is a part of an R package.
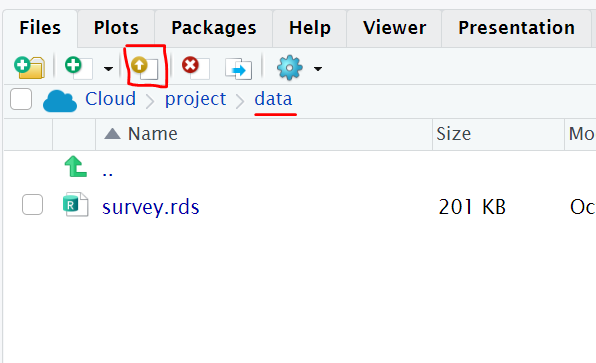
If you choose your own dataset, you will need to upload your data to the Posit Cloud Project. Under the Files Pane, click on the “data” folder, then click the “upload” icon.
Where to find data?
Kaggle: Kaggle offers aggregated datasets, but it’s a community hub rather than a search engine. Kaggle launched in 2010 with a number of machine learning competitions, which subsequently solved problems for the likes of NASA and Ford. It has since evolved into a renowned open data platform, offering cloud-based collaboration for data scientists, as well as educational tools for teaching artificial intelligence and data analysis techniques… plus, of course, tons of great datasets covering almost any topic you can imagine.
Google Dataset Search: Launched in 2018, Google Dataset Search is like Google’s standard search engine, but strictly for data. While it’s not the best tool if you prefer to browse, if you have a particular topic or keyword in mind, it won’t disappoint. Google Dataset Search aggregates data from external sources, providing a clear summary of what’s available, a description of the data, who it’s provided by, and when it was last updated. It’s an excellent place to start.
U.S. Census Bureau: the U.S. Census Bureau publishes reams of demographic data at the state, city, and even zip code level. It is a fantastic data set for students interested in creating geographic data visualizations and can be accessed on the Census Bureau website. Alternatively, the data can be accessed via an API.
Data.gov: In 2015, the US Government made all its data publicly available. With over 200,000 datasets covering everything from climate change to crime, you can lose yourself in the database for hours. For a government website, it has some surprisingly user-friendly search functions, including the ability to drill down by geographical area, organization type, and file format. Search results are also clearly labeled at federal, state, county, and city levels.
FiveThirtyEight: If you’re interested in data at all, you’ve almost certainly heard of FiveThirtyEight; it’s one of the best-established data journalism outlets in the world. They write interesting data-driven articles, like “Don’t blame a skills gap for lack of hiring in manufacturing” and “2016 NFL Predictions”. What you may not know is that FiveThirtyEight also makes the data sets used in its articles available online on Github and on its own data portal.
FBI Crime Data Explorer: If you’re fascinated by crime, the FBI Crime Data Explorer is the one for you. It provides a broad collection of crime statistics from a variety of state organizations (universities and local law enforcement) and government (on a local, regional, and state-level). Pull data on hate crimes, officer assaults, homicides, and more. It also includes some helpful user guides to support data navigation.
Awesome Public Datasets: This github hosts a library of awesome, public datasets! They are all sorted by category and link you straight to the hosting website.
Sports Reference: “Our Primary Aim is to answer our users’ questions with the easiest-to-use, fastest, and most complete sports statistics anywhere. If we have some fun in the process, that’s good too.”
The World Bank: The World Bank is a global development organization that offers loans and advice to developing countries. The World Bank regularly funds programs in developing countries, then gathers data to monitor the success of these programs. You can browse world bank data sets directly. The data sets have many missing values (which is great for cleaning practice).
Spotify API: Discover the millions of tracks, artists, or albums on Spotify in the user’s local market or a specific Spotify market.
Anywhere you want to search!
Project outline
Once you have chosen your dataset you will need to conduct an analysis and create a report. This is a report, meaning anytime you have code you should be explaining what you are doing before the code and any conclusions/findings that result after the code. In other words, there should not be random plots/code without any explanation.
Introduction: Should introduce your dataset, where the data came from, why it is of interest, and any other general introductory statements. Is your dataset generalizable, and if so what is the population of interest? Cite your data link if necessary.
Data Overview: Here you should describe your data. How many variables are in your dataset? How many observations? Are there any missingness issues and why might that be the case? Are there any potential data issues such as impossible/weird values?
EDA: You will need to create a minimum of 2 graphics to explore your data. You cannot use the two same graphs (ie: cannot do 2 scatterplots). These graphics must be made using ggplot, however you are welcome to explore other geom layers that we have not focused on in this class beyond the 5NG. Each graph must have wrangling code that provides appropriate calculations and summary statistics to support the graph. This is a report, meaning there should be a proper description and explanation of the graph.
Regression: Choose 1 numeric and 1 categorical variable to predict a numeric variable. You choose if this is a parallel slopes or interaction model. Write out the equation to your model. Interpret each coefficient in the context of the problem. Provide a graph of the fitted lines.^1
Confidence interval: Develop a confidence interval related research question. Construct you confidence interval, state your confidence level and appropriately interpret in the context of the problem.
Hypothesis test: Develop a hypothesis test related research question. State your null and alternative hypothesis, specify your alpha, perform the hypothesis test, and appropriately interpret in the context of the problem.^2
While you can construct a Confidence Interval and Hypothesis test with any dataset it does NOT mean that it is always appropriate to do so. In your explanation be sure to state if there are any limitations in your conclusions.
- Conclusion: State any concluding remarks.
1: Advanced tip for regression: If you want to visualize your prediction you can plot the observed response on the x axis and the fitted values on the y axis.
2: The confidence interval and hypothesis test must be answering different research questions. The confidence interval/hypothesis test cannot be of the same type (options: mean, proportion, difference in mean, difference in proportion, slope)
Project rubric (50 points)
| 0 | 2 | 4 | |||
|---|---|---|---|---|---|
| Neatness, Organization, Introduction, Conclusion | Use complete sentences; minimal typos; reads as a report; names; headers formatted correctly; suppress warning or messages; introduction and conclusion present with minimum requirements | ||||
| 0 | 1 | 2 | |||
| Data Overview | Thoroughly explored your data using at a minimum the criteria in the project outline. | ||||
| 1 | 2 | 3 | 4 | 5 | |
| EDA: Exploration 1 (x2) | Simple plot/wrangling AND improper explanation AND major error with code/data use | Simple plot/wrangling OR improper explanation OR major error with code/data use | Used a graph and appropriate data wrangling summary statistics to support the graph. Proper explanation and introduction to the exploration. Sufficiently complex, you are showcasing what you learned this quarter. | ||
| EDA: Exploration 2 (x2) | Same criteria as above. Must be a different type of plot. | ||||
| Regression (x2 pts) | Incorrect interpretation OR 2 issues | State the model goal. Used multiple regression model. Stated the model equation. Interpreted the coefficients in the context of the problem. Plot matches model. | |||
| CI (4 points) | Incorrect interpretation OR 2 issues | Stated the research question of interest. Stated CI level. Confidence interval is correct. Interpretation in the context of the problem. | |||
| Hypothesis test (x2 points) | Incorrect interpretation OR 2 issues | Stated the research question of interest. Stated alpha level. Defined H0 and HA using proper notation. Hypothesis test conducted correctly. Interpretation in the context of the problem. |
**Sufficiently complex exploration can mean many things. It can mean doing data wrangling before the plot to narrow down the data of interest or it can mean doing a bi-variate exploration (2 variables or more) and explaining how the variables relate. Ex: Simple exploration: histogram of a single variable using your entire dataset and calculating the mean and standard deviation. Complex exploration: faceting a histogram by a categorical variable and calculating summary statistics by category to explain how different categories vary.
**Be a problem solver. If you don’t know how to write a regression equation or hypothesis copy an example from an activity and modify for your problem.
Cautionary Note
Every member of the group should review EVERY section of the project before submitting. This is a group grade and dividing the work into sections without collaborating often results in poor overall grades.
Failure to contribute to your group will result in a loss of a letter grade. There will be a survey to evaluate your group members contributions and to comment on your own contributions.
Failure to be in a project group on Canvas by the deadline will result in the loss of a letter grade.
If you are having group member issues that need to be addressed with me this must be done prior to Wednesday March 6th.